
Dipti Singh
The pandemic has most certainly generated economic and financial instability. A new Financial Impact Index developed by Taylor Fry provides an analysis of COVID-19 ‘s financial effect on the Australian population compared to pre-pandemic levels.
An interactive map has been created to explore the financial impact of the pandemic via postcode. Postcodes with the highest financial impact are in red colour and those with the least impact are green in colour. The most badly impacted suburbs and regions were put in the 90-100 percentile range and those less affected in the 0-10 percent band.
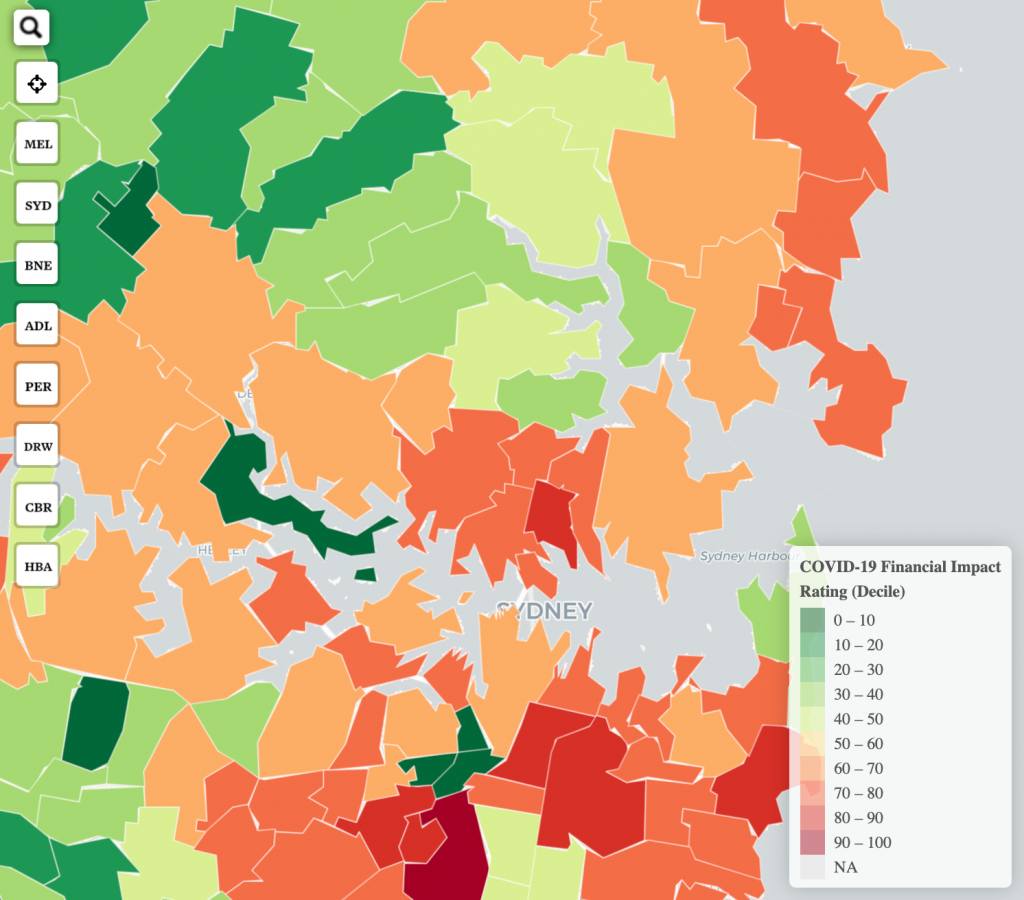
The hardest-hit suburbs tend to have a comparatively high ratio of white-collar professionals and hospitality workers, particularly in cafes and restaurants. These neighbourhoods have a moderately small percentage of retires and recipients dependent on Government income support.
Some of the wealthiest suburbs in Sydney have been among the worst affected but many neighbouring areas have emerged relatively unscathed. The report reveals that the North Shore has fared well, due to a larger proportion of high-income earners who can rely on personal savings. Suburbs like Hornsby, Waitara, Asquith, and Mount Colah fall under the percentile of 40-50, meaning a mid-range effect. Similarly, suburbs like Wahroonga, Warrawee, Pymble, and Killara fall under the 10-20 decile which depicts suburbs that have experienced less impact.
Macquarie Park and Marsfield are the least affected suburbs as the industry is comprised of 16.25 of retired and unemployed people who are reliant on government income and falls under 0-10 percentile. Suburbs like North Ryde, Gladesville, Lane Cove, Greenwich have faced more financial crises as they fall under the 60-70 decile and are in the orange zone. 3.5% of people fall under the category of no income on the map which is leading to a negative income impact in the area.
To see the Financial Impact Index, visit: https://taylorfry.com.au/articles/covid-19-financial-impact-index/